

Accounting 101: Understand Accounting - A New Colour System To Simplify It
“Accounting is the language of business, and you have to learn it like language. You can't be comfortable in the country if you aren't comfortable with the language. To be successful at business, you have to understand the underlying financial values of the business." (Warren Buffet)
It is often said that accountants speak a strange language. This leads to many people in business not really understanding the income statements and balance sheets that are presented to them. This puts them at a business disadvantage.
Why is accounting difficult to understand?
Simply put, accounting is reporting to owners and stakeholders how an organisation is performing.
But instead of thinking simply, accountants use mathematical equations and language that is not well understood. For example, at a recent meeting of senior financial officers in the U.K., 75% did not get the definition of “expenses” correct.
In the U.S.A. an organisation – Accounting Comes Alive International – has pioneered the Colour Accounting system. It uses three concepts and the use of a visual colour coded diagram to explain accounting.
A colour coded diagram to explain it all
The concepts are -
(If the diagram below does not display correctly, please see the “online version” – link above the compliments slip)
© Color Accounting International
(NOTE: The diagram above is the property of “Color Accounting International” and is reproduced here with their permission)
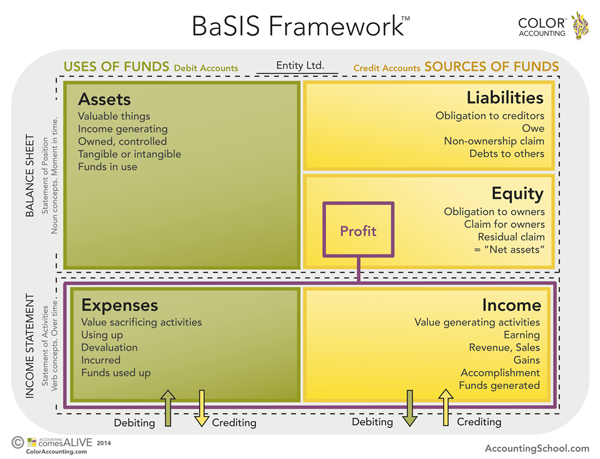
Have a look at the BaSIS Framework (Balance Sheet and Income Statement) model above; it is called the “Value Cycle” and makes use of colour as it is something we easily grasp.
The yellow boxes depict “sources of funds” – in the top right hand column owners contribute funds as equity and can also obtain funds by borrowing or incurring liabilities. Equity and liabilities are used (moving to green in the top left hand corner) to acquire assets which are “used up” (bottom left corner). This is done to generate sales or income (bottom right hand corner in yellow as it generates funds for the business). The difference between income and expenses is the profit or loss which is transferred to Equity (top right hand box). This profit is either paid to owners (dividends) or to third party funders (creditors) who receive interest plus debt repayments. The balance is used to acquire more assets and so the cycle continues.
We hope that helps shed some light on how accountancy works and how it adds value to your business!
A colour coded diagram to explain it all
The concepts are -
- Structure. A unique quadrant colour framework (see diagram below) is used to illustrate how a business works and how accounting reports this.
A business is set up with capital called owner’s equity. The owners can leverage the business by incurring debt. The owner’s equity plus debt is used to acquire assets. The assets plus owner’s equity and debt are the infrastructure of the business. This is also called the balance sheet. The balance sheet reflects assets, liabilities and equity at a defined moment in time.
- Language. Simple language enhances our understanding. If you look at the diagram below, the creators have used simple words and concepts to explain accounting. For example, the balance sheet is explained in nouns. As said above it is the infrastructure of the entity and this infrastructure is used to generate activities which we call the profit and loss or income statement.
- Activities. The balance sheet assets are used to create revenue or sales. This is done by “value sacrificing activities” known to you and me as “expenses”. For example, advertising uses up assets (cash in bank) to create demand for the business’ products or services. Expenses and revenue are verb concepts as they are part of the activities which happen over a period of defined time such as twelve months (annual financial statements) or a month (monthly management accounts). This is known as the profit and loss statement or the income statement.
(If the diagram below does not display correctly, please see the “online version” – link above the compliments slip)
© Color Accounting International
(NOTE: The diagram above is the property of “Color Accounting International” and is reproduced here with their permission)
Have a look at the BaSIS Framework (Balance Sheet and Income Statement) model above; it is called the “Value Cycle” and makes use of colour as it is something we easily grasp.
The yellow boxes depict “sources of funds” – in the top right hand column owners contribute funds as equity and can also obtain funds by borrowing or incurring liabilities. Equity and liabilities are used (moving to green in the top left hand corner) to acquire assets which are “used up” (bottom left corner). This is done to generate sales or income (bottom right hand corner in yellow as it generates funds for the business). The difference between income and expenses is the profit or loss which is transferred to Equity (top right hand box). This profit is either paid to owners (dividends) or to third party funders (creditors) who receive interest plus debt repayments. The balance is used to acquire more assets and so the cycle continues.
We hope that helps shed some light on how accountancy works and how it adds value to your business!
Provided by May and Company
© DotNews. All Rights Reserved.